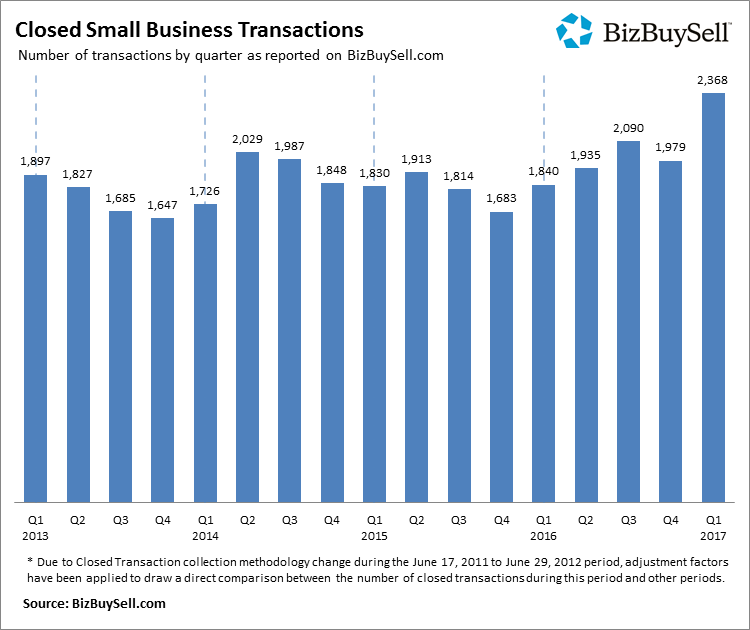
The BizBuySell Insight Report on small business transactions for the first quarter for 2017 has been released. The results tout a “hot and balanced market” with a spike in transactions, as well as, record-setting median revenues and cash flows. Transactions were up 29% from the previous year, totaling 2,368. Overall outlook for the transaction market is positive, supported by a strengthening economy, buyer/seller confidence and healthy business financials.


Baby Boomers looking to capitalize on today’s favorable conditions and exit small business ownership for retirement are fueling the market supply.
– BizBuySell.com, Q1 2017 Insight Report
Key Financials of Sold Small Businesses
The median revenue of companies sold increased, continuing the trend of setting new highs.
Click image to view full size.
Small Business Listing Metrics by Geography for First Quarter, 2017
We’ve summarized the data for the region as published by BizBuySell. For data on all territories, please see the full chart on BizBuySell.
| Market | # of Businesses Listed | Median Asking Price | Median Revenue | Asking Price to Revenue (average) | Median Cash Flow | Asking Price to Cash Flow (average) |
| Bridgeport-Stamford-Norwalk, CT | 156 | $210,000 | $500,000 | 0.60 | $112,155 | 2.55 |
| New Haven-Milford, CT | 139 | $260,000 | $500,000 | 0.66 | $124,520 | 3.20 |
| Hartford-West Hartford-East Hartford, CT | 143 | $199,000 | $500,000 | 0.62 | $84,000 | 2.55 |
| Providence-New Bedford-Fall River, RI-MA | 137 | $250,000 | $596,932 | 0.61 | $120,000 | 2.78 |
| Boston-Cambridge-Quincy, MA-NH | 560 | $250,000 | $511,739 | 0.63 | $120,000 | 2.56 |
| Albany-Schenectady-Troy, NY | 131 | $259,000 | $478,000 | 0.76 | $121,432 | 2.64 |
| Buffalo-Niagara Falls, NY | 40 | $255,000 | $582,500 | 0.69 | $130,000 | 3.59 |
| Rochester, NY | 97 | $199,000 | $380,000 | 0.71 | $72,000 | 3.15 |
| New York-Northern New Jersey-Long Island, NY-NJ-PA | 5853 | $290,000 | $574,125 | 0.70 | $134,000 | 2.74 |
| New Jersey | 1925 | $250,184 | $465,000 | 0.80 | 108,302 | 3.05 |
